Population by Free/Enslaved Status and Racial Classification, Santiago do Iguape, 1835
This table shows the distribution of Santiago do Iguape’s population by free/enslaved status and racial classification.
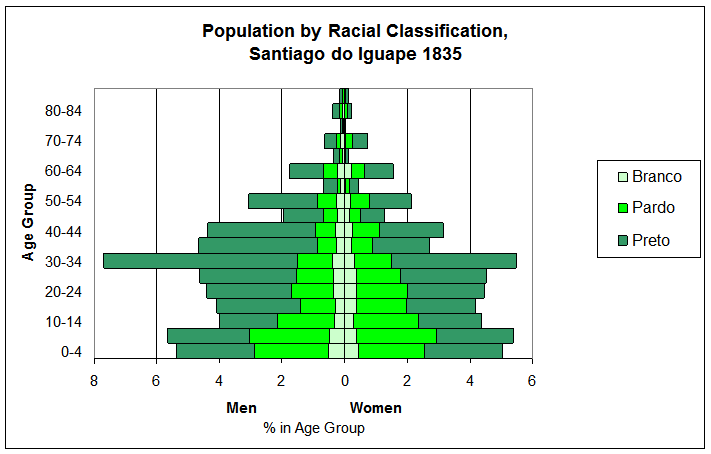
Population by Racial Classification, Santiago do Iguape 1835
This population pyramid shows the distribution of Santiago do Iguape’s inhabitants by sex, age, and race.
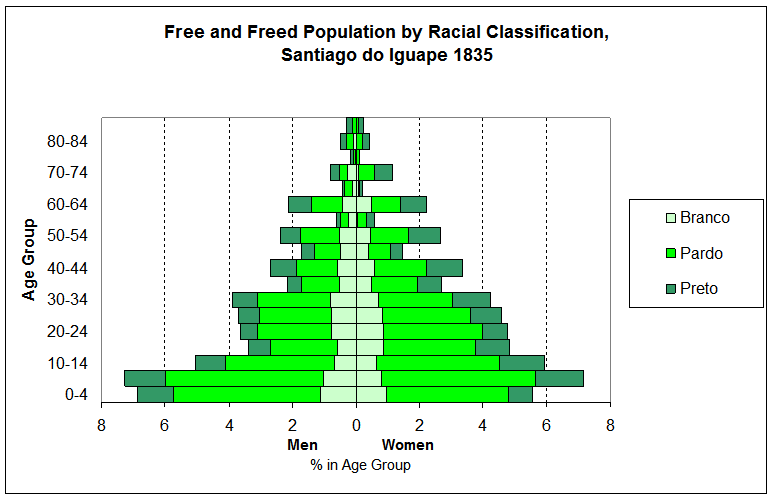
Free and Freed Population by Racial Classification, Santiago do Iguape 1835
This population pyramid shows the distribution of Santiago do Iguape’s free and freed inhabitants by sex, age, and place of birth.
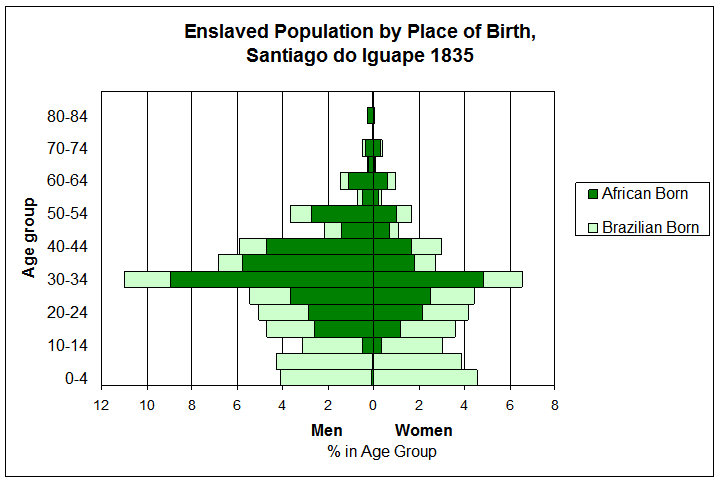
Enslaved Population by Place of Birth, Santiago do Iguape, 1835
This population pyramid contrasts the sex and age structure of Iguape slaves born in Brazil with those born in Africa.
Occupation of Household Head, Santiago do Iguape, 1835
This chart considers the economic focus of Iguape’s households.
Distribution of Slaveholders and Slaves by Number of Slaves in Holding, Santiago do Iguape 1835
This chart analyzes the distribution of slaves in Santiago do Iguape, considering both the percentage of slaveholders with different numbers of slaves, and the percentage of slaves living in small, medium, and large cohorts.
Presence of Slaves & Agregados by Race of Household Heads, Santiago do Iguape 1835
This chart analyzes the proportion of households containing family labor, free dependents, and slaves.
Household Size in Santiago do Iguape, 1835
This chart considers the mean and median household sizes found in Santiago do Iguape.
Head of Household Family Types in Santiago do Iguape, 1835
An analysis of the family types (simple, complex, no-structure) found in Santiago do Iguape.
Population Composition of Santiago do Iguape, 1835 & 1872
This chart examines the population of Santiago do Iguape by free/enslaved status and racial category, considering how the parish’s inhabitants changed over the course of the nineteenth century.
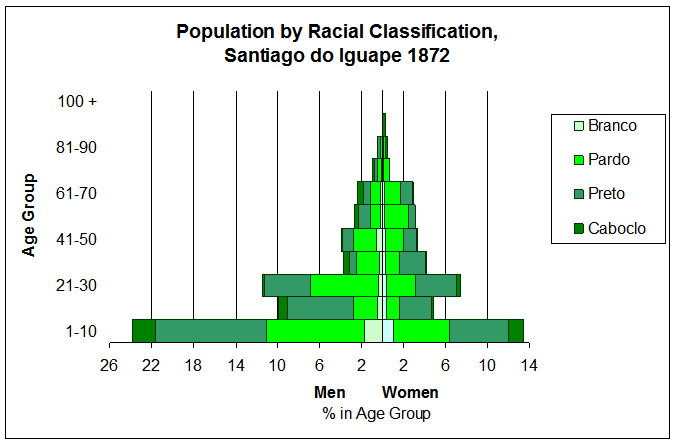
Population by Racial Classification, Santiago do Iguape, 1872
This population pyramid constructed from information recorded in the 1872 Brazilian National Census shows the distribution of Santiago do Iguape’s inhabitants by sex, age, and race.
Population by Free/Enslaved Status and Racial Classification, Santiago do Iguape, 1835
| Racial & Civil Category | Proportion |
| Free & Freed | 46.3% |
| Branco | 8.1% |
| Pardo & Cabra | 27.6% |
| Preto | 10.8% |
| Enslaved | 53.7% |
| Brazilian-Born | 25.2% |
| African-Born | 28.6 |
Source: Santiago do Iguape Household Census. Note: only seven individuals are listed as “cabra” in the census.
This chart presents a demographic overview of the individuals listed in the 1835 Santiago do Iguape census. Slaves are the majority of the population, and most of these slaves were born in Africa. Given the harsh living and working conditions on sugar plantations, the proportionally small number of female slaves, and plantation owners’ calculation that replacing slaves was less expensive than guarding for their health, crioulos (Brazilian-born slaves) were less numerous. This demonstrates the dependence of Bahian sugar plantations on the trans-Atlantic slave trade for labor.
It is also interesting to note the predominance of people of color (pardos, cabras, and pretos) among the free and freed population. Only 8.1% of Iguape’s residents were identified as branco. This stands in notable contrast to the slave societies of North America.
Acknowledging material from this website
Population by Racial Classification, Santiago do Iguape 1835
Source: Santiago do Iguape Household Census.
Population pyramids show a population’s composition by age and sex. A pyramidal shape, roughly equally distributed between men and women characterizes a growing society with a large component of children and young adults.
The population pyramid for all inhabitants of Santiago do Iguape in 1835 shows the wide band of working-aged adults, suggesting the immigration of large numbers of male and female workers. It is interesting to note that the pardo population and the branco population follow a more typical shape, and that the distortion is most visible in the preto population. The largest band is for preto men aged 30-34.
Acknowledging material from this website
Free and Freed Population by Racial Classification, Iguape 1835
Source: Santiago do Iguape Household Census.
Population pyramids show a population’s composition by age and sex. A pyramidal shape, roughly equally distributed between men and women characterizes a growing society with a large component of children and young adults.
Iguape’s free and freed populations follow this stable pattern, with young people outnumbering their elders. Two things stand out: the dramatic differences between the five-year bands for the older ages, and the way women slightly outnumber men after age ten. The irregular bands for older ages is most likely a result of pooling as older census respondents estimated their ages with multiples of ten. There are several factors that could account for the predominance of number of women among the free adult population. One possibility is research shows enslaved women were more likely to earn their freedom than men.
The most significant impact of this population pyramid comes when it is compared with the demographic portrait of the enslaved population that follows.
Acknowledging material from this website
Enslaved Population by Place of Birth, Santiago do Iguape, 1835
Source: Santiago do Iguape Household Census.
Population pyramids show a population’s composition by age and sex. A pyramidal shape, roughly equally distributed between men and women characterizes a growing society with a large component of children and young adults.
This population pyramid of Santiago do Iguape’s slave shows a population deeply contoured by the international slave trade and the demands of sugar production. First, the vast majority of Santiago do Iguape’s slaves were from age fifteen to forty-five years old – adults in their prime productive years – reflecting the high value placed on slaves’ labor capacities. The broad central section of the figure is typical of societies experiencing a large influx of adult migrants. Second, most of Santiago do Iguape’s enslaved adults were born in Africa. The labor demands of Recôncavo sugar production went far beyond those which could be meet by the crioulo population. Third, the sex ratio (number of men per one hundred women) of Iguape’s slaves was highly imbalanced. There were 146 enslaved men for every 100 enslaved women living in Santiago do Iguape parish in 1835. The asymmetrical shape of the population pyramid for Iguape reflects the high proportion of male slaves.
Acknowledging material from this website
Occupation of Household Heads, Santiago do Iguape, 1835
| Occupation | Percent of Household Heads |
| Professionals | 2.9 |
| Business & Transportation | 4.8 |
| Agriculture & Livestock | 44.6 |
| Artisans | 31.9 |
| Domestic Service | 1.2 |
| Day Laborers | 2.1 |
| Unemployable or No Information | 11.9 |
| Total | 100.0 |
Acknowledging material from this website
Population Composition of Santiago do Iguape, 1835 & 1872
| 1835 | 1872 | |
| Free & Freed | 46.3% | 70.8% |
| Branco | 8.1% | 6.7% |
| Pardo & Cabra | 27.6% | 32.7% |
| Preto | 10.7% | 23.7% |
| Caboclo & Other | 0.1% | 7.7% |
| Enslaved | 53.7% | 29.2% |
| Brazilian-born | 25.2% | 28.6% |
| African-Born | 28.6% | 0.5% |
Sources: The 1835 data comes from the 1835 Santiago do Iguape Household Census. 1872 data from “Provincia da Bahia: Parochia de S. Thiago do Iguape,” Recenseamento da população do Imperio do Brazil a que se procedeu no dia 1° de agosto de 1872 (Rio de Janeiro: A Directoria, 1873): vol. 3, p. 85.
Note: Caboclo referred to an individual of mixed Portuguese and Brazilian Amerindian heritage, and did not appear on the 1835 census. Percentages add up to slightly more than 100% in some cases due to rounding.
This tables highlights the changes to Santiago do Iguape’s population over the course of the nineteenth century. With the effective closure of the trans-Atlantic slaved trade in 1851, the economic decline of the Bahian sugar industry, and the growing market for slaves on Brazilian coffee plantations in the southeast, both the number and proportion of slaves declined significantly by 1872. Still, slavery remained an essential source of labor in Santiago do Iguape, and nearly one in three people were enslaved.
The place of birth of Santiago do Iguape’s slaves changed dramatically as well: African slaves were a majority in 1835, but by 1872, the census only lists forty-two enslaved African. The 1872 census also counts seventy-three freed Africans.
Acknowledging material from this website
Population by Racial Classification, Santiago do Iguape, 1872
Source: “Provincia da Bahia: Parochia de S. Thiago do Iguape,” Recenseamento da população do Imperio do Brazil a que se procedeu no dia 1° de agosto de 1872 (Rio de Janeiro: A Directoria, 1873): vol. 3, p. 85.
Population pyramids show a population’s composition by age and sex. A pyramidal shape, roughly equally distributed between men and women characterizes a growing society with a large component of children and young adults.
This population pyramid constructed from information recorded in the 1872 Brazilian National Census shows the distribution of Santiago do Iguape’s inhabitants by sex, age, and race. The published information for the 1872 national census only lists age grouped into ten year cohorts, so this pyramid provides less detailed information. Even so, the recorded proportion of children aged ten and younger – representing a reported 37.2% of the population – is astonishing if correct. The other possibility could be a significant out-migration of workers in their thirties and forties.
Acknowledging material from this website
Distribution of Slaveholders and Slaves by Number of Slaves in Holding, Santiago do Iguape 1835
| Size of slave holding | Number of Slaveholders | Percent | Number of Slaves | Percent |
| 1-3 | 89 | 42.2 | 144 | 3.6 |
| 4-6 | 40 | 19.0 | 202 | 5.1 |
| 7-10 | 19 | 9.0 | 156 | 3.9 |
| 11-20 | 27 | 12.8 | 356 | 8.9 |
| 21-50 | 19 | 9.0 | 576 | 14.4 |
| 51-101 | 7 | 3.3 | 516 | 14.6 |
| 101-200 | 6 | 2.8 | 1249 | 31.3 |
| 200+ | 4 | 1.9 | 723 | 18.1 |
| Total | 211 | 100.0 | 3989 | 100.0 |
Source: Santiago do Iguape Household Census.
Note: Santiago do Iguape contained 965 households headed by free individuals, so 21.9% of households included slaves. Multiple holdings by the same owner have been added together.
This table looks at the distribution of slaves recorded in the Santiago do Iguape Household Census. In Santiago do Iguape, the economic demands of sugar plantations for large workforces shaped the composition of slave holdings. Slave ownership was highly concentrated among owners of sugar plantations and smaller lavradores who grew sugarcane to be processed at the plantation mills; although slaves comprised more than half of the population in Santiago do Iguape in 1835, they were only present in a little more than one-fifth of households (21.6%). The Gini index for slave ownership in Santiago do Iguape was 0.76, reflecting their highly inequitable distribution.
In 1835 seventy-eight percent of Santiago do Iguape’s slaves lived among cohorts of more than twenty other enslaved people. The properties identified in the census as engenhos housed enslaved populations ranging from forty-seven to two hundred and fifty individuals. This sizable population would have increased slaves’ daily contact with other slaves, facilitating cultural autonomy and the formation of family and social ties.
Acknowledging material from this website
Presence of Slaves & Agregados by Race of Household Heads, Santiago do Iguape 1835
| Household contains: | ||||||
|---|---|---|---|---|---|---|
| Family Labor Only | Slaves Present | Agregados Present | ||||
| N | % | N | % | N | % | |
| Branco | 75 | 39.1 | 108 | 56.3 | 41 | 21.4 |
| Pardo | 349 | 72.1 | 88 | 18.2 | 69 | 14.3 |
| Preto | 238 | 84.1 | 11 | 3.9 | 36 | 12.7 |
| All households | 662 | 69.0 | 207 | 21.6 | 146 | 15.2 |
Source: Santiago do Iguape 1835 Household Census. Totals do not add up to 100% because some household contained both slaves and agregados.
Nineteenth-century agriculture, and especially sugar production, was extremely labor intensive. One measure of social and economic capital in Santiago do Iguape was the control of dependent labor, whether free or enslaved. More than one-fifth of Iguape households included enslaved workers. Agregados, free dependents linked to landholders by ties of patronage and protection, coercion and necessity, were represented in fifteen percent of households.
It is interesting to consider the relationship between the head of households’ racial category and the presence of non-family workers. Most branco households included slaves (56.3%), a significantly higher proportion than households headed by pardos (18.2%) or pretos (3.9%). The pattern for the presence of agregados is similar, although the difference in the proportion of households commanding this free labor is fairly similar for pardos (14.3%) and pretos (12.7%). This chart highlights the links between race and economic power in 1835 Iguape.
Acknowledging material from this website
Household Size in Santiago do Iguape, 1835
| Household Members Included | Central Tendency | |
| Full Household | Mean | 7.0 |
| Median | 4 | |
| Household Excluding Slaves | Mean | 3.6 |
| Median | 3 | |
| Household Excluding Agregados | Mean | 6.7 |
| Median | 3 | |
| Household Excluding Slaves & Agregados | Mean | 3.2 |
| Median | 3 | |
Source: Santiago do Iguape 1835 Household Census. Excludes slave-only households. While “slave-only” households might seem odd, the household census compiler identified the estates of recently-deceased individuals in the process of probate as separate households.
This chart analyzes the mean (average) and median (the middle value when all of the cases in a set are listed in order of size) size of households in Santiago do Iguape. It is important to consider both the mean and the median household sizes – especially when slaves are included in the household size – because the hundreds of slaves on a few sugar plantations are enough to substantially raise the mean.
The median size is four people for complete households, and three if only family members are considered. This is interesting because it suggests residential patterns other than the large, extended families we often image for the nineteenth-century.
Acknowledging material from this website
Head of Household Family Types in Santiago do Iguape, 1835
| Family Type | N | % |
| Solitary | 282 | 29.4 |
| Unmarried | 212 | 22.1 |
| Married (Spouse Absent) | 20 | 2.1 |
| Widow(ed) | 50 | 5.2 |
| No Structure | 54 | 5.6 |
| Co-resident Siblings | 16 | 1.7 |
| Others | 38 | 3.9 |
| Simple | 566 | 59.1 |
| Couple without Children | 105 | 10.9 |
| Couple with Children | 270 | 28.2 |
| Unmarried Parent with Children | 102 | 10.6 |
| Widow(er) with Children | 77 | 8.0 |
| Married Solitary Parent with Children | 13 | 1.4 |
| Complex | 57 | 5.9 |
| Extended Families | 33 | 3.4 |
| Multiple Families | 24 | 2.5 |
| Total Solitary or No Structure | 336 | 35.0 |
| Total Simple or Complex | 623 | 65.0 |
Source: Santiago do Iguape Household Census.
E. A. Hammel and Peter Laslett have developed a schema for comparing family structures in different societies that divides households into five categories based on their arrangement of individuals into family groups. Only members of the head of household’s family are considered; other household intimates like agregados and slaves do not influence household structure. Under Hammel and Laslett’s definition, a simple family consists of a “conjugal family unit”: a pair of related individuals, whether a cohabitating couple or a solitary parent and child. Parents living with their childless children are another example of simple families. Solitary households consist of individuals living alone. Households with individuals other than simple families living together, even if they are groups of siblings, are classified as “no structure” because they do not contain a conjugal family unit. “Multiple” households consist of more than one conjugal family unit – for example, a couple living with the wife’s parents – and “extended” households of a conjugal family unit with a relative outside the simple unit who does not form a separate conjugal family unit – for example, a married couple living with the husband’s mother. For further details, see E. A. Hammel and Peter Laslett, “Comparing Household Structure over Time and between Cultures,” Comparative Studies in Society and History 16 (1974): 86-88.
Nearly thirty percent of Santiago do Iguape households were headed by a solitary dweller; a further 5.6 percent consisted of groups of unrelated adults. The “no structure” households combined individuals who chose to live together to share household expenses, to benefit from shared economic production, or because of unrecorded affective ties outside of the bounds of blood relationships. Such living arrangements were especially common among freed slaved who did not remain in their former masters’ households as agregados.
For a detailed analysis of the household structure of senhores de engenho and the most prosperous lavradores in 1835 Santiago do Iguape, see B. J. Barickman, “Revisiting the Casa-grande: Plantation and Cane-Farming Households in Early Nineteenth-Century Bahia,” Hispanic American Historical Review 2004 84(4):619-660. Barickman found that 60% of Engenho households consisted of simple families, only slightly more than my calculation for the entire parish’s population.
Acknowledging material from this website
Acknowledging information from this website
The information and analysis in this website is distributed under a Creative Commons Attribution Non-Commercial Share-Alike license. Materials on this website can be reproduced for educational or non-commercial use if they are acknowledged.
Chicago Style:
Holt, Katherine. “Title of Graph.” The Bahian History Project: The 1835 Santiago do Iguape Household Census Database.” http://www.mappingbahia.org/project/.


